Japan's Population Structure
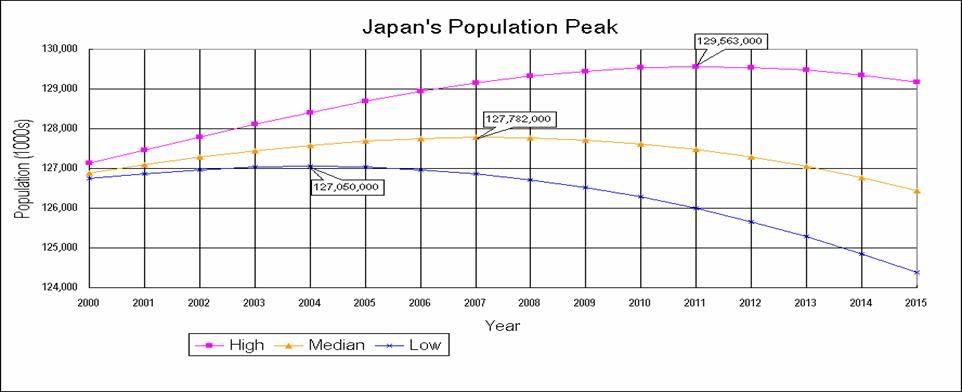
Japan's population, currently 128,085,000, experienced a high growth rate during the 20th century, as a result of scientific, industrial, and social changes. Population growth has more recently decreased, because of falling birth rates and almost no net immigration. High sanitary and health standards produce a life expectancy exceeding that of any other nation in the world. The population started declining in 2005, as the 1.067 million births were exceeded by the 1.077 million deaths. Assuming current birth and death rates, the 2005 population of 127 million will decline to 100 million in 2050, and 64 million in 2100--and keep falling. The main problem will be the financial crisis that comes from having a higher and higher Dependency ratio (that is, nonworking young and old compared to working ages.)
Japan is an urban society with only about 5% of the labor force engaged in agriculture. Many farmers supplement their income with part-time jobs in nearby towns and cities. About 80 million of the urban population are heavily concentrated on the Pacific shore of Honshu and in northern Kyushu. Metropolitan Tokyo with approximately 12 million; Yokohama with 3,555,473; Osaka 2,624,129; Nagoya 2,190,549; Sapporo 1,854,837; Kobe 1,513,967; Kyoto 1,466,163; Fukuoka 1,325,611; Kawasaki 1,290,426; and Kitakyushu with 1,000,211 each account for part of this population. Japan faces the same problems that confront urban industrialized societies throughout the world: over-crowded cities, congested highways, air pollution, and rising juvenile delinquency.
Japanese society is linguistically, though not ethnically, homogeneous with small populations of primarily Ryukyuans (1.5 million), Koreans (0.6 million), Chinese and Taiwanese (0.5 million), Filipinos (0.5 million), Brazilians (250,000), Vietnamese (200,000) and Iranians (150,000). Japan has indigenous minority groups such as the Ainu and Ryukyuans, and social minority group like burakumin. Japanese citizenship is conferred jus sanguinis, and monolingual Japanese-speaking minorities often reside in Japan for generations under permanent residency status without acquiring citizenship in their country of birth. About 99% of the population speaks Japanese as their first language. Japan has total of 200,000-some residents of European and North American nationalities, usually are temporary residents and a small percentage are naturalized citizens.[citation needed]
Population density
Japan's population density is 339 persons per square kilometer according to the United Nations World Populations Prospects Report as of July 2005. It ranks 30th in a list of countries by population density, ranking directly above India (336 per km², 31st), and directly below Belgium (341 per km², 29th). Japan's population density has helped promote extremely high land prices. Between 1955 and 1989, land prices in the six largest cities increased 15,000 %. Urban land prices generally increased 40 % from 1980 to 1987; in the six largest cities, the price of land doubled over that period. For many families, this trend put housing in central cities out of reach. The result was lengthy commutes for many workers; daily commutes of up to two hours each way are not uncommon in the Tokyo area. Despite the large amount of forested land in Japan, parks in cities are smaller and scarcer than in major West European or North American cities, which average ten times the amount of parkland per inhabitant.
National and regional governments devote resources to making regional cities and rural areas more attractive by developing transportation networks, social services, industry, and educational institutions in attempts to decentralize settlement and improve the quality of life. Nevertheless, major cities, especially Tokyo, remain attractive to young people seeking education and jobs.
Age structure
Like other postindustrial countries, Japan faces the problems associated with an aging population. In 1989, only 11.6 % of the population was sixty-five years or older, but projections were that 25.6 % would be in that age category by 2030. That shift will make Japan one of the world's most elderly societies, and the change will have taken place in a shorter span of time than in any other country.
This aging of the population was brought about by a combination of low fertility and high life expectancies. In 1993 the fertility rate was estimated at 10.3 per 1,000 population, and the average number of children born to a woman over her lifetime has been fewer than two since the late 1970s (the average number was estimated at 1.5 in 1993). Family planning was nearly universal, with condoms and legal abortions the main forms of birth control. A number of factors contributed to the trend toward small families: late marriage, increased participation of women in the labor force, small living spaces, and the high costs of children's education. Life expectancies at birth, 76.4 years for males and 82.2 years for women in 1993, were the highest in the world. (The expected life span at the end of World War II, for both males and females, was fifty years.) The mortality rate in 1993 was estimated at 7.2 per 1,000 population. The leading causes of death are cancer, heart disease, and cerebrovascular disease, a pattern common to postindustrial societies.
Public policy, the media, and discussions with private citizens revealed a high level of concern for the implications of one in four persons in Japan being sixty-five or older. By 2025 the dependency ratio (the ratio of people under fifteen years plus those sixty-five and older to those aged fifteen to sixty-five, indicating in a general way the ratio of the dependent population to the working population) was expected to be two dependents for every three workers. The aging of the population was already becoming evident in the aging of the labor force and the shortage of young workers in the late 1980s, with potential impacts on employment practices, wages and benefits, and the roles of women in the labor force. The increasing proportion of elderly people in the population also had a major impact on government spending. As recently as the early 1970s, social expenditures amounted to only about 6 % of Japan's national income. In 1992 that portion of the national budget was 18 %, and it was expected that by 2025, 27 % of national income would be spent on social welfare.
In addition, the median age of the elderly population was rising in the late 1980s. The proportion of people aged seventy-five to eighty-five was expected to increase from 6 % in 1985 to 15 % in 2025. Because the incidence of chronic disease increases with age, the healthcare and pension systems, too, are expected to come under severe strain. The government in the mid-1980s began to reevaluate the relative burdens of government and the private sector in health care and pensions, and it established policies to control government costs in these programs. Recognizing the lower probability that an elderly person will be residing with an adult child and the higher probability of any daughter or daughter-in-law's participation in the paid labor force, the government encouraged establishment of nursing homes, day-care facilities for the elderly, and home health programs. Longer life spans are altering relations between spouses and across generations, creating new government responsibilities, and changing virtually all aspects of social life.

Population: 127,463,611 (July 2006 est.) people in 47,062,743 households, 78.7 % in urban areas (July 2000). High population density; 329.5 persons per square kilometer for total area; 1,523 persons per square kilometer for habitable land. More than 50 % of population lives on 2 % of land. (July 1993)
Population growth rate:
0.02% (2006 est.)
0.05% (2005 est.)
0.08% (2004 est.)
0.11% (2003 est.)
0.18% (2000 est.)
Birth rate:
9.37 births/1,000 population (2006 est.)
9.47 births/1,000 population (2005 est.)
9.56 births/1,000 population (2004 est.)
9.61 births/1,000 population (2003 est.)
9.96 births/1,000 population (2000 est.)
Death rate:
9.16 deaths/1,000 population (2006 est.)
8.95 deaths/1,000 population (2005 est.)
8.75 deaths/1,000 population (2004 est.)
8.55 deaths/1,000 population (2003 est.)
8.15 deaths/1,000 population (2000 est.)
Age structure:
0-14 years: 14.2% (male 9,309,524/female 8,849,476)
15-64 years: 65.7% (male 42,158,122/female 41,611,754)
65 years and over: 20% (male 10,762,585/female 14,772,150) (2006 est.)

Sex ratio:
at birth: 1.05 male(s)/female
under 15 years: 1.05 male(s)/female
15-64 years: 1.01 male(s)/female
65 years and over: 0.73 male(s)/female
total population: 0.95 male(s)/female (2006 est.)
Infant mortality rate:
total: 3.24 deaths/1,000 live births
male: 3.5 deaths/1,000 live births
female: 2.97 deaths/1,000 live births (2006 est.)
Life expectancy at birth:
total population: 81.25 years
male: 77.96 years
female: 84.7 years (2006 est.)
Total fertility rate:
1.4 children born/woman (2006 est.)
HIV/AIDS - adult prevalence rate:
less than 0.1% (2004 est.)
HIV/AIDS - people living with HIV/AIDS:
12,000 (2003 est.)
HIV/AIDS - deaths:
500 (2003 est.)
Nationality:
noun: Japanese (singular and plural)
adjective: Japanese
Ethnic Groups: 99.4 % Japanese and 0.6 % other, mostly Korean (40.4% of non-Japanese) and some Chinese. Ainu, Ryukyuans and hisabetsu buraku constitute native Japanese minority groups. Japanese people are considered to be a homogeneous race but recent studies have shown that the Japanese race is very mixed. It consists of Korean, Altaic, Tungusic, northern Chinese, Polynesian and proto-Mongoloid blood [citation needed] .
Foreign Citizens: More than 2.5 million (possibly higher because of the illegal immigrants), 14.9% up in five years. North and South Koreans 1 million, Chinese 0.5 million, Filipinos 0.5 million, and Brazilian 250,000 with others like Peruvian, American, Canadian, British, Indonesian, Thai, African, Iranian, Russian, and other nationals.
Marriage Status:
Over 15: Married Male 61.8%, Female 58.2%. Never married Male 31.8%, Female 23.7%.
25 - 29: Never married Male 69.3%, Female 54.0%.
30 - 34: Never married Male 42.9%, Female 26.6% (July 2000).
Religion: No reliable statistics exist since census does not have questions regarding religion.
Net migration rate:
0 migrant(s)/1,000 population (2006 est.)
Language: Japanese. Emphasis on English as a second language.
Literacy: definition: age 15 and over can read and write
total population: 99% (2002 est.)
male: 99% (2002 est.)
female: 99% (2002 est.)
Japan is an urban society with only about 5% of the labor force engaged in agriculture. Many farmers supplement their income with part-time jobs in nearby towns and cities. About 80 million of the urban population are heavily concentrated on the Pacific shore of Honshu and in northern Kyushu. Metropolitan Tokyo with approximately 12 million; Yokohama with 3,555,473; Osaka 2,624,129; Nagoya 2,190,549; Sapporo 1,854,837; Kobe 1,513,967; Kyoto 1,466,163; Fukuoka 1,325,611; Kawasaki 1,290,426; and Kitakyushu with 1,000,211 each account for part of this population. Japan faces the same problems that confront urban industrialized societies throughout the world: over-crowded cities, congested highways, air pollution, and rising juvenile delinquency.
Japanese society is linguistically, though not ethnically, homogeneous with small populations of primarily Ryukyuans (1.5 million), Koreans (0.6 million), Chinese and Taiwanese (0.5 million), Filipinos (0.5 million), Brazilians (250,000), Vietnamese (200,000) and Iranians (150,000). Japan has indigenous minority groups such as the Ainu and Ryukyuans, and social minority group like burakumin. Japanese citizenship is conferred jus sanguinis, and monolingual Japanese-speaking minorities often reside in Japan for generations under permanent residency status without acquiring citizenship in their country of birth. About 99% of the population speaks Japanese as their first language. Japan has total of 200,000-some residents of European and North American nationalities, usually are temporary residents and a small percentage are naturalized citizens.[citation needed]
Population density
Japan's population density is 339 persons per square kilometer according to the United Nations World Populations Prospects Report as of July 2005. It ranks 30th in a list of countries by population density, ranking directly above India (336 per km², 31st), and directly below Belgium (341 per km², 29th). Japan's population density has helped promote extremely high land prices. Between 1955 and 1989, land prices in the six largest cities increased 15,000 %. Urban land prices generally increased 40 % from 1980 to 1987; in the six largest cities, the price of land doubled over that period. For many families, this trend put housing in central cities out of reach. The result was lengthy commutes for many workers; daily commutes of up to two hours each way are not uncommon in the Tokyo area. Despite the large amount of forested land in Japan, parks in cities are smaller and scarcer than in major West European or North American cities, which average ten times the amount of parkland per inhabitant.
National and regional governments devote resources to making regional cities and rural areas more attractive by developing transportation networks, social services, industry, and educational institutions in attempts to decentralize settlement and improve the quality of life. Nevertheless, major cities, especially Tokyo, remain attractive to young people seeking education and jobs.
Age structure
Like other postindustrial countries, Japan faces the problems associated with an aging population. In 1989, only 11.6 % of the population was sixty-five years or older, but projections were that 25.6 % would be in that age category by 2030. That shift will make Japan one of the world's most elderly societies, and the change will have taken place in a shorter span of time than in any other country.
This aging of the population was brought about by a combination of low fertility and high life expectancies. In 1993 the fertility rate was estimated at 10.3 per 1,000 population, and the average number of children born to a woman over her lifetime has been fewer than two since the late 1970s (the average number was estimated at 1.5 in 1993). Family planning was nearly universal, with condoms and legal abortions the main forms of birth control. A number of factors contributed to the trend toward small families: late marriage, increased participation of women in the labor force, small living spaces, and the high costs of children's education. Life expectancies at birth, 76.4 years for males and 82.2 years for women in 1993, were the highest in the world. (The expected life span at the end of World War II, for both males and females, was fifty years.) The mortality rate in 1993 was estimated at 7.2 per 1,000 population. The leading causes of death are cancer, heart disease, and cerebrovascular disease, a pattern common to postindustrial societies.
Public policy, the media, and discussions with private citizens revealed a high level of concern for the implications of one in four persons in Japan being sixty-five or older. By 2025 the dependency ratio (the ratio of people under fifteen years plus those sixty-five and older to those aged fifteen to sixty-five, indicating in a general way the ratio of the dependent population to the working population) was expected to be two dependents for every three workers. The aging of the population was already becoming evident in the aging of the labor force and the shortage of young workers in the late 1980s, with potential impacts on employment practices, wages and benefits, and the roles of women in the labor force. The increasing proportion of elderly people in the population also had a major impact on government spending. As recently as the early 1970s, social expenditures amounted to only about 6 % of Japan's national income. In 1992 that portion of the national budget was 18 %, and it was expected that by 2025, 27 % of national income would be spent on social welfare.
In addition, the median age of the elderly population was rising in the late 1980s. The proportion of people aged seventy-five to eighty-five was expected to increase from 6 % in 1985 to 15 % in 2025. Because the incidence of chronic disease increases with age, the healthcare and pension systems, too, are expected to come under severe strain. The government in the mid-1980s began to reevaluate the relative burdens of government and the private sector in health care and pensions, and it established policies to control government costs in these programs. Recognizing the lower probability that an elderly person will be residing with an adult child and the higher probability of any daughter or daughter-in-law's participation in the paid labor force, the government encouraged establishment of nursing homes, day-care facilities for the elderly, and home health programs. Longer life spans are altering relations between spouses and across generations, creating new government responsibilities, and changing virtually all aspects of social life.
Population: 127,463,611 (July 2006 est.) people in 47,062,743 households, 78.7 % in urban areas (July 2000). High population density; 329.5 persons per square kilometer for total area; 1,523 persons per square kilometer for habitable land. More than 50 % of population lives on 2 % of land. (July 1993)
Population growth rate:
0.02% (2006 est.)
0.05% (2005 est.)
0.08% (2004 est.)
0.11% (2003 est.)
0.18% (2000 est.)
Birth rate:
9.37 births/1,000 population (2006 est.)
9.47 births/1,000 population (2005 est.)
9.56 births/1,000 population (2004 est.)
9.61 births/1,000 population (2003 est.)
9.96 births/1,000 population (2000 est.)
Death rate:
9.16 deaths/1,000 population (2006 est.)
8.95 deaths/1,000 population (2005 est.)
8.75 deaths/1,000 population (2004 est.)
8.55 deaths/1,000 population (2003 est.)
8.15 deaths/1,000 population (2000 est.)
Age structure:
0-14 years: 14.2% (male 9,309,524/female 8,849,476)
15-64 years: 65.7% (male 42,158,122/female 41,611,754)
65 years and over: 20% (male 10,762,585/female 14,772,150) (2006 est.)
Sex ratio:
at birth: 1.05 male(s)/female
under 15 years: 1.05 male(s)/female
15-64 years: 1.01 male(s)/female
65 years and over: 0.73 male(s)/female
total population: 0.95 male(s)/female (2006 est.)
Infant mortality rate:
total: 3.24 deaths/1,000 live births
male: 3.5 deaths/1,000 live births
female: 2.97 deaths/1,000 live births (2006 est.)
Life expectancy at birth:
total population: 81.25 years
male: 77.96 years
female: 84.7 years (2006 est.)
Total fertility rate:
1.4 children born/woman (2006 est.)
HIV/AIDS - adult prevalence rate:
less than 0.1% (2004 est.)
HIV/AIDS - people living with HIV/AIDS:
12,000 (2003 est.)
HIV/AIDS - deaths:
500 (2003 est.)
Nationality:
noun: Japanese (singular and plural)
adjective: Japanese
Ethnic Groups: 99.4 % Japanese and 0.6 % other, mostly Korean (40.4% of non-Japanese) and some Chinese. Ainu, Ryukyuans and hisabetsu buraku constitute native Japanese minority groups. Japanese people are considered to be a homogeneous race but recent studies have shown that the Japanese race is very mixed. It consists of Korean, Altaic, Tungusic, northern Chinese, Polynesian and proto-Mongoloid blood [citation needed] .
Foreign Citizens: More than 2.5 million (possibly higher because of the illegal immigrants), 14.9% up in five years. North and South Koreans 1 million, Chinese 0.5 million, Filipinos 0.5 million, and Brazilian 250,000 with others like Peruvian, American, Canadian, British, Indonesian, Thai, African, Iranian, Russian, and other nationals.
Marriage Status:
Over 15: Married Male 61.8%, Female 58.2%. Never married Male 31.8%, Female 23.7%.
25 - 29: Never married Male 69.3%, Female 54.0%.
30 - 34: Never married Male 42.9%, Female 26.6% (July 2000).
Religion: No reliable statistics exist since census does not have questions regarding religion.
Net migration rate:
0 migrant(s)/1,000 population (2006 est.)
Language: Japanese. Emphasis on English as a second language.
Literacy: definition: age 15 and over can read and write
total population: 99% (2002 est.)
male: 99% (2002 est.)
female: 99% (2002 est.)

0 Comments:
Post a Comment
<< Home